Business
The Saddest Spreadsheet In America Goes On The Record; Column F Has Always Been The Problem
1,247 rows, seven columns, and one measurement nobody asked for.
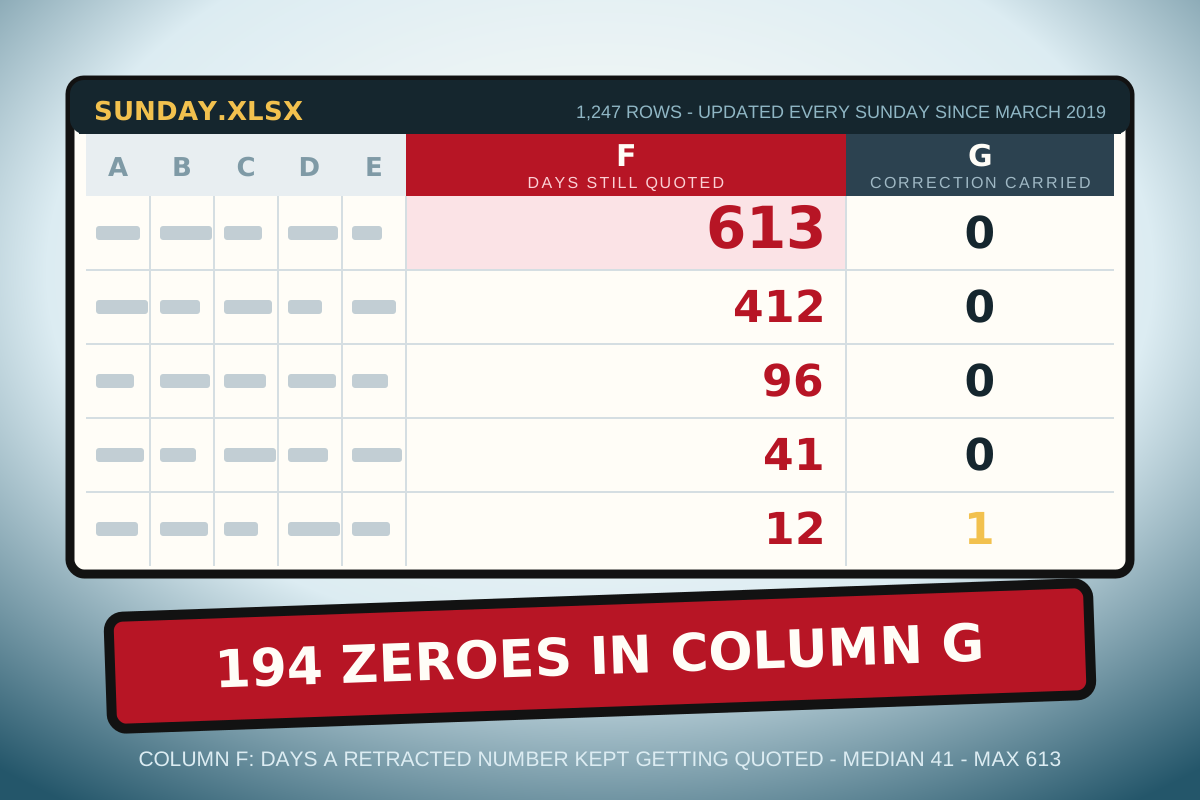
The spreadsheet is real, in the sense that it is a file. It has been updated every Sunday since March 2019. It now holds 1,247 rows and seven columns, and colleagues who have been shown it describe it, without prompting and with remarkable consistency, as the saddest spreadsheet they have ever seen. Beginning this quarter it is a standing feature of this desk. The reasoning for publishing it appears at the end, and it is not a flattering reason.
Columns A through E are unremarkable and will not detain anyone. Date of claim. Claim as printed. Source relied upon. Outcome as later established. Delta, signed, in the unit of the original claim. Anyone who has kept a forecasting log has kept these five columns, and they behave the way forecasting logs behave: the deltas are small, the sign is roughly balanced, and the distribution is boring. A boring distribution is a good result and a bad column to read about.
Column F
Column F was added in 2021 and it does not measure whether the claim was wrong. It measures the number of days between the publication of the correction and the last observed instance of the original figure being cited by somebody else as current. The median is 41 days. The mean is 96, which tells you the distribution has a tail. The maximum entry is 613 days, and that row is a payroll revision I corrected in the second paragraph of the following morning's piece.
A number does not stop existing when it is retracted. It stops being mine and becomes a fact with no author, which is a more durable form of number than the kind I publish. Column F is the measurement of that transfer. I have not found a way to shorten it. The three shortest entries in column F are all cases where the original figure was too large to be useful to anyone, which is not a strategy I can recommend or reproduce.
"You built a column that measures how long you keep being wrong after you stop being wrong. I want you to hear that sentence in the order you wrote it." Jin-Ah Park, who was asked to check the formula and did
The Row I Would Prefer To Skip
Row 1,102, dated February 2025, is a forecast that consumer sentiment would deteriorate through the following two quarters by a margin I put in print at 8 to 11 points. It deteriorated by 1.4 and then recovered. The delta in column E is the second largest in the file. I was wrong, I was wrong by a lot, and I was wrong in the direction I expected to be right in, which is the only direction that carries information about the forecaster rather than the forecast.
The related finding is the one I have rechecked most often and would most like to be a formula error. Sorted by absolute delta, the subset of rows concerning this administration's economic figures is the most accurate subset in the file, and it is accurate because the figures kept landing where the administration said they would land and I kept writing that they would not. The rows are wrong in a consistent direction and the direction is mine. I have checked the sort three times. The sort is fine.
Column G was added last quarter and it is the reason this became a feature rather than a habit. It is a binary. It records whether any outlet that carried the original figure also carried the correction. Of the 213 rows eligible for column G, the entry is 1 in nineteen cases. The remaining 194 are zeroes. Bob Callahan has asked twice for the file. He is getting the file.
This goes on the record because a private accuracy log is an accuracy log graded by the person it grades, and I have spent six years describing that arrangement as insufficient when other people use it. The quarterly will publish column F and column G in full and will not publish columns A through E, which are between me and the file. The next update is Sunday. It is always Sunday.
Methodological note: Column F requires an observation of the original figure in circulation, so it undercounts by construction; an uncited wrong number is recorded as zero days, which is the most generous possible reading and is applied to 71 rows. The tail behavior is consistent with the persistence documented in Federal Reserve Bank of Philadelphia Working Paper 21-14, which found that revised initial estimates continue to appear in secondary commentary well after revision. That paper studies institutions. This file studies one person, which is a sample of one, which I have noted in the file, in column H, which I have not mentioned until now.